Analyze key financial metrics like IRR, Cap Rate and Cash-On-Cash return for your next real estate deal
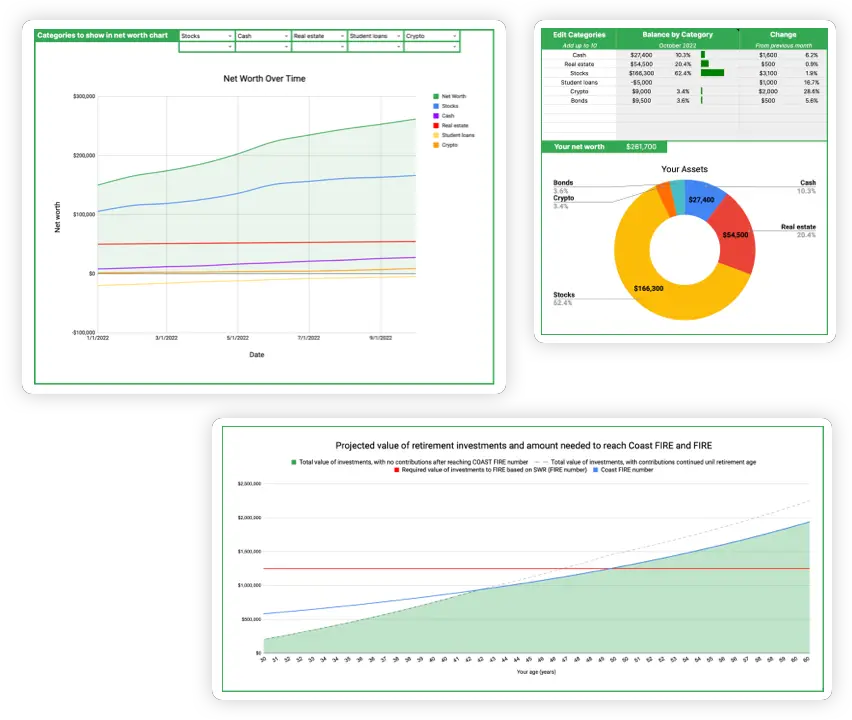
Take your wealth planning to the next level with my Wealth Planning Toolkit for Google Sheets – just $20.
Plan for recurring monthly income over different time periods as well as windfalls and one-time purchases in the future.
Includes 10 year Net Worth Tracker with Dashboard, Asset Rebalancing Calculator, and advanced FIRE and Coast FIRE Calculators.
Real estate investing overview
Real estate investing is a tried and true way to build wealth and is considered to be a key pillar of any diversified investing portfolio. Here are a few reasons why you should consider real estate as part of your long-term investing strategy:
- Real estate is relatively less volatile compared to equities and bonds.
- Real estate helps to diversify your portfolio because it has a low or in some cases even negative correlation with other major assets classes like stocks.
- Real estate is an excellent inflation hedge. As the economy grows, demand for real estate grows as well, driving rents higher and increasing the value of your property.
- Compared to other asset classes, real estate allows investors to use much more leverage thanks to a special financing method: the mortgage. This means that you can control the entire asset and capture all appreciation while only paying a fraction of the value of the property, with typical down payments ranging from 3.5% to 20% of the property’s purchase price. Leverage is a double-edged sword however, because when the value of property goes down, your losses are also amplified and your equity in the property can become quickly wiped out. A mortgage is said to be underwater when the current market value of the property is less than the original principal on the mortgage. Depending on how much the value of the property has decreased, it’s even possible to have negative equity, which makes it difficult to refinance or sell the property.
This interactive calculator allows you to input the details of your real estate property deal and automatically calculate key real estate investing metrics like monthly cashflow, cash-on-cash return, IRR, and cap rate shown in the Deal Analysis section.
You can click on Annual breakdown over 20 years to view the projected cash flow and cash-on-cash return for each year you hold the property.
Some things to keep in mind
It’s important to understand that the metrics from this calculator are projections based on your inputs, and investment performance is not guaranteed. Make sure to do your due diligence when evaluating an investment property and understand any risks that could be unique to that property or real estate market.
Investing in rental properties is not completely passive income – it requires you to put in time, energy, and money as a landlord to manage tenants and maintain the property. Many landlords will use a property management company to handle the day-to-day responsibilities of running your rental, but this does come with a management fee, usually around 10% of collected rent. Property management can be especially helpful for landlords who don’t live near the property or who have limited time.
Deal Analysis: understanding the key financial metrics for real estate investing
In the Deal Analysis section, this calculator automatically runs the numbers on several key real estate financial metrics that you can use to analyze if this property is worth your investment.
Cash Flow
Monthly cash flow = rental income - mortgage payment - all operating expensesIn general, a higher cash flow is better, but investors may be willing to accept a lower cashflow to own a property that has a higher appreciation potential.
Net Operating Income
Net operating income (NOI) = rental income - all reasonably necessary operating expenses.Capitalization rate (cap rate)
Cap rate = NOI / property valueThe cap rate is considered to be among the best metrics to forecast the return-on-investment from a property and compare it to other properties. Knowing the property’s cap rate helps you to estimate how long it will take to recoup your initial investment into the property and also indicates the level of risk involved with the property. Cap rates are correlated with risk, so in general the higher the cap rate, the more risk you are taking on by investing in the property.
This calculator uses the property’s NOI for the first year divided by the purchase price to calculate the cap rate.
There is no universal rule for what is a good or bad cap rate in the real estate industry. There are many factors that impact cap rate including size of the market, the location, and property type. Some investors prefer higher cap rates in the 8%+ range, knowing that they are taking on higher risk. In general, around a 5% cap rate is optimal and strikes a balance between risk and return.
Cash-on-cash return
Cash-on-cash return = annual cash flow / cash invested into property.Cash-on-cash return, or put simply the cash yield, is another key metric that tells investors the annual cash yield relative to the upfront cash invested in the deal. Cash-on-cash return is useful because it takes into account the long-term debt used to finance the property purchase, unlike the cap rate which is independent of financing.
If a property is purchased in cash with no financing, then the cash-on-cash return is the same as the cap rate.
What is considered a good cash-on-cash return depends on the local market and your expectations for future appreciation as an investor. Higher is generally better with cash-on-cash returns, and some investors may be happy with 5% to 10% cash-on-cash returns while others may target 10%+.
You can click on Annual breakdown over 20 years to expand a table that shows the cash-on-cash return for the property over each year during the holding period. If your annual cash flow increases over time (based on your annual increase numbers for each input), then cash-on-cash return will also increase over time because the upfront cash investment in the deal is unchanged.
IRR (Internal rate of return or simply return)
Internal rate of return, or simply IRR or return, is a very important metric which measures the all-in annualized return based on all projected cashflows over the property’s holding period.
IRR is calculated by setting the Net Present Value in a discounted cash flow formula to 0 and then solving for the discount rate. IRR is difficult to calculate manually, which is where this calculator comes in.
While IRR and Return-on-investment (ROI) are similar metrics, IRR is generally preferred by real estate investors because it incorporates the time value of money into the annualized return, while ROI does not. ROI only measures the return on the investment after sale relative to the cost, and does not take into account your income while holding the property.
Knowing the IRR is very useful because it allows you to compare the projected returns from this property investment with other properties and even non-real estate investments like stocks or private equity deals.
In general, a higher IRR is better than a lower IRR when all other factors are equal. Be mindful that IRR does not capture investment risk.
Total profit after sale
The total profit after sale is the sum of all cash flows over the time that you own the property. Total profit includes your gains from selling the property and it factors in your sale expenses as well as the initial investment you put into the property when you purchased it.
Property purchase inputs
Purchase price is the price you pay to buy the property, not including closing costs.
Down payment is the percentage of the purchase price you pay out-of-pocket. The typical down payment for investment properties is 20 to 25%, but for owner-occupied real estate, you may be able to put down as little as 3.5% with an FHA loan. If you’re buying the property in cash, then you should set this value to 100%.
Interest rate is the fixed interest rate on your loan which you would pay off over the loan duration. As of November 2022, the current average rate for a 30 year fixed mortgage in the USA was 7%.
Loan duration is the length of time over which you will pay off the loan. The most common loan durations in the USA are 30-year and 15-year.
Closing costs are processing fees that you pay to your lender to obtain your mortgage and include things like Applications fees, Appraisal, and Loan Origination fees. Closing costs are typically between 3% and 6% of your loan amount.
Rehab costs are the costs of any improvements that you make to the property after purchasing it and before you rent it out.
Income inputs
Monthly rent is the total value of rent that is collected from your tenants each month. This does not include property management fees.
Vacancy rate is the percentage of time when your property is unoccupied and you are not collecting rent from a tenant. One month of vacancy per year implies an 8% vacancy rate.
Property Management fee. If you do not manage the rental yourself, you will need to hire a property manager to do so. Property managers typically charge 10% of the monthly rent as a fee.
Yearly expense inputs
Property taxes are based on the assessed value of your property and vary by state, county, and locality that the property is located in. State property tax rates as a percentage of property value range from 0.28% in Hawaii to 2.49% in New Jersey.
Landlord insurance protects your property against damage and also provides personal liability coverage. It protects your property against damage from natural disasters like storms, lightning, and hail as well as fire damage and damage from tenants. Generally landlord insurance costs about 15% more than homeowner insurance. Landlord insurance varies by geographic region as well as size, value, and age of your property. The national average for landlord insurance is $1,288 per year.
You will need to budget for Homeowner’s Association (HOA) fees if your property is in an HOA. HOA fees are standard for condos, apartments, and single-family homes in planned communities and are used to pay for amenities, property maintenance and repairs. These fees will vary by property and location but typically range between $200 and $300 per month.
Budgeting for maintenance of your property is important to keep it in good condition and to be prepared for unexpected repairs that may come up. Neglected maintenance can often cause bigger, more expensive problems down the line, so being proactive with maintenance will save you money and headaches over the long term. A common rule of thumb is the 1% of property value formula, which says that you should budget for 1% of your property’s value to be spent each year on maintenance. Factors like age and condition of your property will influence the amount of maintenance required.
Other expenses is a bucket for any other miscellaneous expenses that you anticipate. This could include utilities like water, sewer, gas, or trash collection or things like landscaping or snow removal.
Sale inputs
Sale price is the price that you expect to sell the property at the end of the holding length.
Holding length is the length of time in years that you plan to keep the property as a rental before selling it.
Sale expenses depend on the value of your property and typically total 8 to 10% of the sale price. As a seller, your biggest sale expense is typically the commission to your real estate agent, with a national average commission coming in at 5.8% of the property sale price. Closing costs are the second biggest sale expense at 1-3% of the sale price. Closing costs are related to the transfer of ownership of the property to the buyer and include things like title fees, settlement fees, and transfer taxes. You may also want to budget for repair, preparation, and staging of your property to maximize your sale price.