Coast FIRE background
In my article What is Coast FIRE: The Complete Guide to Coasting to Financial Independence, I do a deep dive into the concept of Coast FIRE. To save you some reading, here’s the gist of it:
I built a Coast FIRE Calculator to allow you to easily calculate your Coast Fire number and visualize your Coast FIRE path.
Once your net worth has passed what we will call your Coast FIRE number, you still need to earn enough to cover your expenses each month, but you no longer need to be setting aside funds to ensure your traditional retirement. Using historically proven growth and inflation rates, you can allow the compounding growth of your existing investments over time to accumulate to support a traditional retirement. With a lower income requirement, you gain the freedom to pursue a more stressful or meaningful job that pays less, shift to working part-time, or just have more spending money to enjoy life.
For more about the math behind calculating your Coast FIRE number, check out my complete guide to Coast FIRE.
Using the Coast FIRE grid
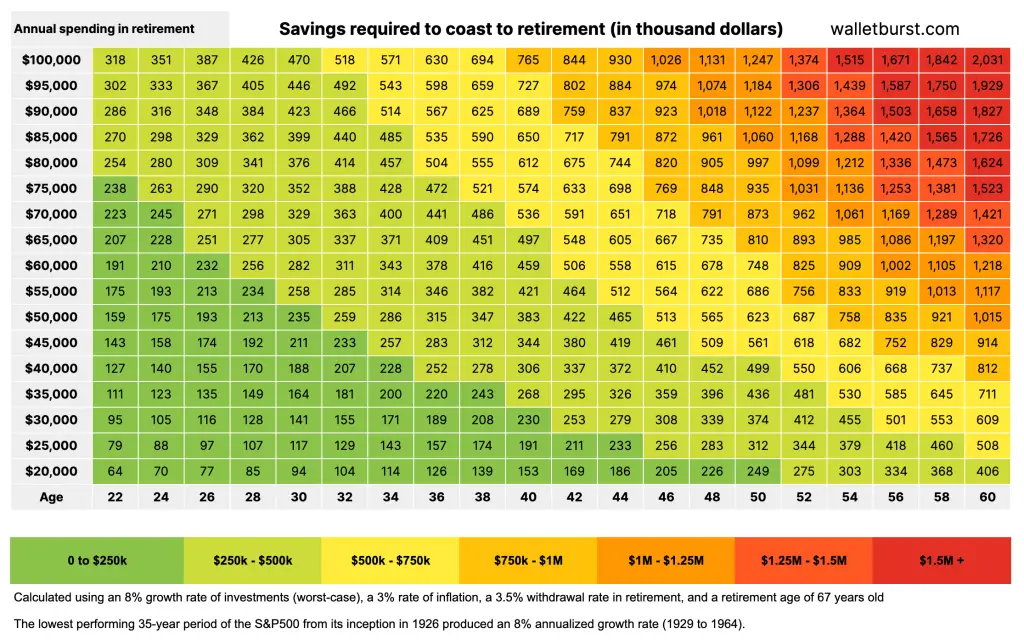
I created the Coast FIRE grid to make things easy using conservative, historically proven rates of investment returns and inflation. This grid illustrates how much you need to have saved and invested to allow you to “coast” to retirement, depending on your age and spending in retirement. To use it, simply find the colored cell that lines up with your age along the x-axis and your expected spending in retirement along the y-axis. The number in this cell is your CoastFIRE number at your age. If you have greater than or equal to this amount saved and invested then your have reached your Coast FIRE milestone!
Note that these expected spending in retirement numbers are in today’s dollars, meaning that you do not need to account for inflation since it is already baked in to the projected growth.
Assumptions
Note that this grid uses a few assumptions to generate your Coast FIRE number:
- An average investment rate of return of 8%
- An average inflation rate of 3%
- A safe withdrawal rate of 3.5%
- A retirement age of 67
Although the stock market has historically produced an annualized average return of about 10% over the last century (source: MarketWatch), I used an 8% annual return for the grid to illustrate the historical worst-case scenario. Since its inception in 1926, the S&P500 index’s lowest-performing 35-year period produced an annualized return of 8% from 1929 to 1964 (source: A Wealth of Common Sense). Even if you invested a lump sum at the peak of the market in 1929, right before the biggest crash in stock market history, you would have still experienced an 8% annualized return if you stayed in the market for the next 35 years. Using a lower annualized return than 10% (such as 8%) helps to account for the risk of downshifting to Coast FIRE at the top of the market before a crash like the 2008 financial crisis or the 2020 Covid-19 crash.
Historically, the inflation rate has averaged 3% annually over the last century (source: inflationdata.com).
To customize these assumptions, here is the Google spreadsheet that generates the grid that you can view, copy, and edit.